
Relative Sizing: Estimating Without the Pain
Remember those "guess how many lollies in the jar" fundraisers? Despite best efforts, everyone's guess was wildly wrong. But if you asked people to compare two jars and say which has more? They'd nail it every time.
As humans we are terrible at estimating the actual size of something, whether it's the number of lollies in the jar or the effort to complete a piece of work. However, we're surprisingly good at relative sizing.
Relative Sizing is one of our favourite ways to create fast, shared understanding of effort or value without getting lost in hours, days or detailed analysis.
What is Relative Sizing?
Instead of trying to estimate the actual size of something (which we're all terrible at), we simply compare one thing to another (which we're surprisingly good at).
Relative Sizing is the act of comparing a new work item with an existing “anchor” work item so that we can add the new item to a standardised group of items that are all approximately the same size.
Relative sizing can be used at any level and at any stage of your work. The benefit of creating standardised groups is that we can rapidly scale the scope of our sizing activity to provide early forecasts that can be quickly adapted based on the actual delivery data of just a small sample of items from each group.
This technique can be used to estimate the effort, value, technical risk and business risk of any work item.
It's a highly visual 2 step approach that can be quickly repeated as new information is discovered.
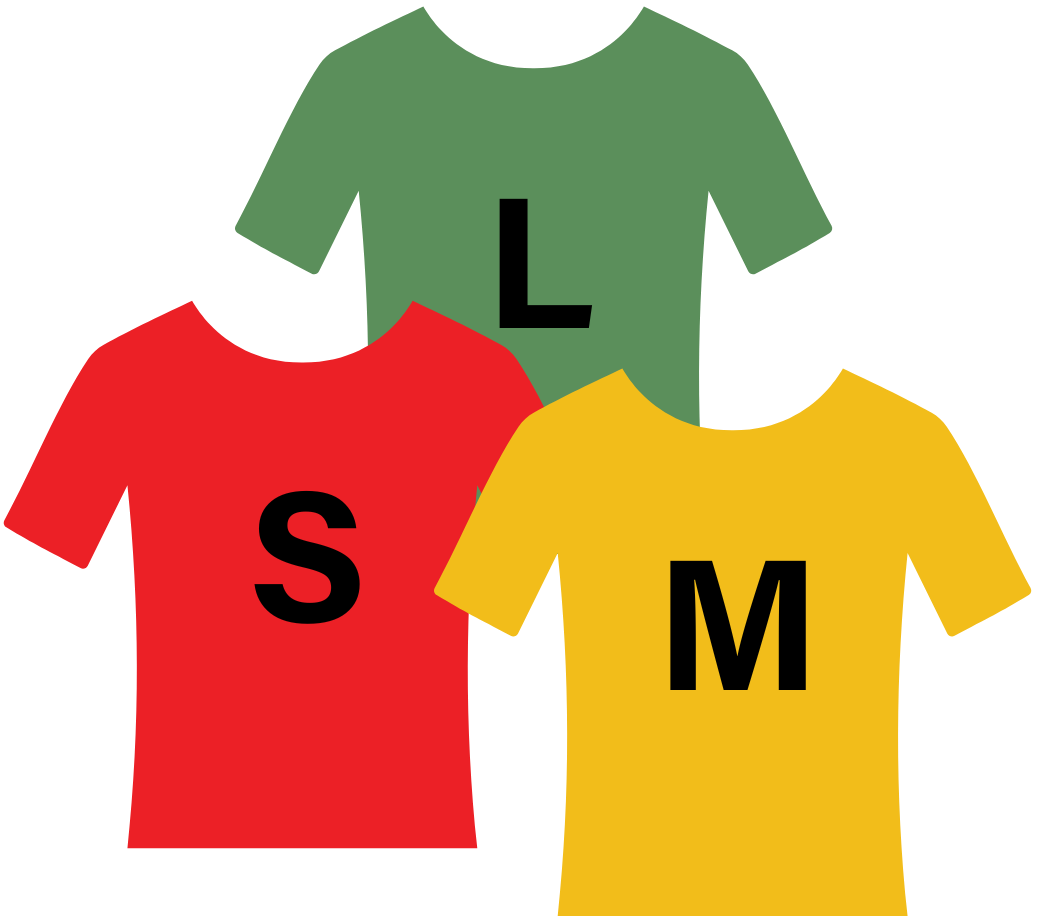
We start with T-Shirt Sizing - Small (S), Medium (M), Large (L) A familiar, accessible way to get started. Everyone understands t-shirt sizes. They are our sizing metaphor for standardised groups..
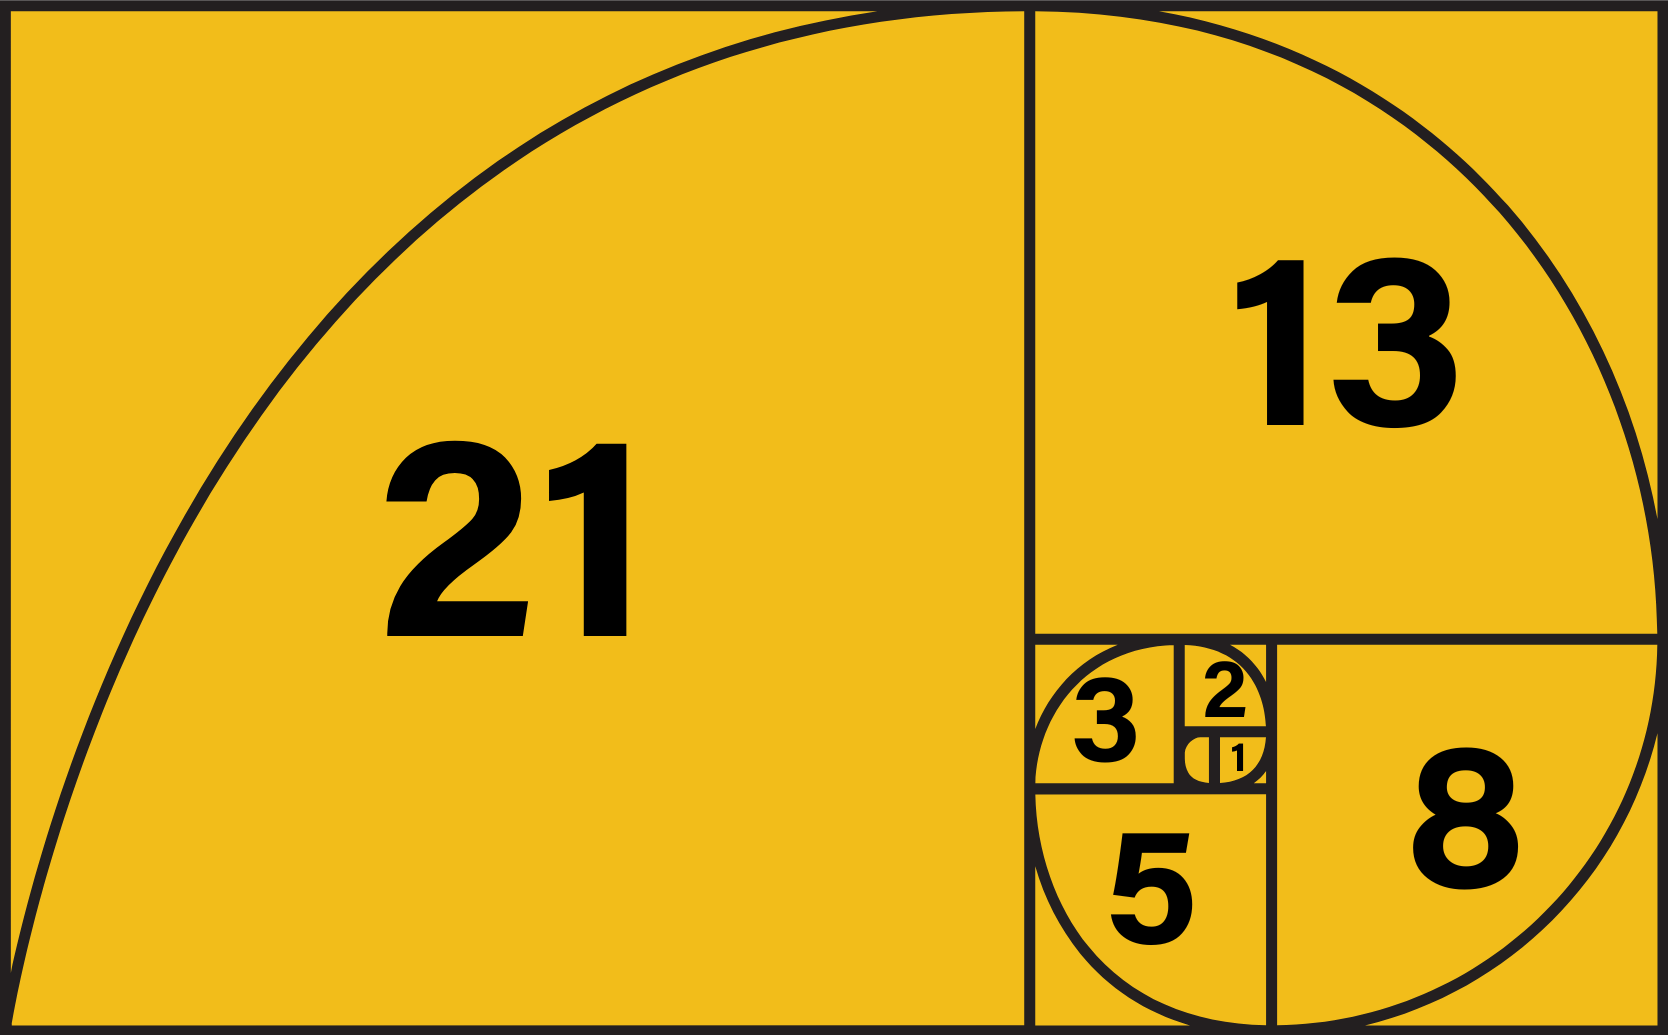
Then we translate to Fibonacci Numbers - 1, 2, 3, 5, 8, 13, 21. The Fibonacci sequence starts at 1 and the next number is the sum of the previous two. Click here to learn more about the Fibonacci sequence.
The reason we need to translate to numbers is that t-shirts don't work well in spreadsheet calculations. The beauty of using Fibonacci numbers for estimating is that as the sequence progresses, the gap between the numbers gets proportionally bigger which reflects the growing uncertainty when estimating the size of larger items of work.
We translate our t-shirt sizes into Fibonacci numbers to inform our value and delivery forecasts:
XXS = 1
XS = 2
S = 3
M = 5
L = 8
XL = 13
XXL = 21
Remember that sizing is relative, not absolute. A Medium today should be roughly the same size as a Medium next week. This consistency lets teams forecast based on their own delivery history and leads to increased delivery velocity as team performance grows.
Why We Love It
Relative Sizing helps shift the conversation by:
Creating a shared language for sizing; effort, value and uncertainty across the team.
Surfacing different perspectives and assumptions early, before work starts.
Building forecasting capability based on actual data from delivery history.
Replacing lengthy estimation debates with quick, practical decisions.
Focusing quickly on what matters: is this roughly the same, smaller or bigger?
Recognising that the people doing the work are best placed to size it.
When We Use It
We reach for Relative Sizing when:
Leaders are looking for more reliable delivery forecasts.
Teams are learning to estimate together for the first time.
A team is planning their next sprint or release.
New work is being added to the backlog.
We need to be able to compare the size of different options.
The beauty of relative sizing is its flexibility. Whether you're planning three months ahead or refining next week's work, the same approach helps teams build shared understanding and reliable delivery.
How We Do It
We start with T-Shirt Sizing:
We lay out the t-shirt sizing cards as column headers, starting with S, M and L.
We pick an item from the backlog that feels like a Medium size and place it under the Medium column. This becomes our anchor for further comparison.
We then take turns sizing the rest of the backlog. For each item we ask:
Is this roughly the same size as the anchor item? If it is, it goes in the Medium t-shirt column.
Is it significantly smaller? If it is, it goes in the Small t-shirt column.
Is it significantly larger? If it is, it goes in the Large t-shirt column.
Once the backlog is t-shirt sized, we do a quick scan of the items in each column to confirm that everything in that t-shirt column still seems approximately the same size now we are looking at them all together.
As we scan the S and L t-shirt columns we may realise that we have outliers at either side. We add XS and XXS or XL and XXL t-shirt columns to manage these outliers. We let the backlog items tell us how many t-shirt sizes we need.
We then move to Fibonacci:
With the backlog items grouped into t-shirt columns, we flip the t-shirt cards over to reveal the Fibonacci numbers that we will use for our forecasting.
Relative sizing is a team activity. The collaborative nature of the sizing conversations gives us confidence as it reveals our different assumptions, surfaces hidden risks and builds the shared understanding that turns estimates into reliable forecasts.
Things to Look Out For

The people doing the work should do the sizing - don't let one person dominate or size work for others. You want the wisdom of the crowd, not just one opinion. Different teams might size the same work differently because they have different skills, experience and bias. This is why teams need to size their own work.
Sizing isn't a promise - it's a best guess. Its is based on intelligent conversation, spotting unseen opportunities and supporting informed decisions. But don't confuse it with a quote or a contract as it will change as the team learn more
Perfect consensus is a myth - if people disagree, that's useful information. Talk about why, then make a call and keep moving.
Reliability matters more than accuracy - you're not trying to be right about absolute size. You're trying to reliably improve your forecasts over time. If items are sized relatively, then as the team learns more about their delivery capability, it's easy to extrapolate the information across the standardised groups and quickly adapt the previous forecasts well ahead of their delivery time.
Don't jump straight to numbers - start with t-shirts. If you skip straight to Fibonacci numbers, teams will often slip back into estimating in actual hours or days. The t-shirt step helps break that “actuals” habit.
Use Fibonacci sequence, not doublingsequence - we prefer the Fibonacci sequence over the simple doubling sequence because our experience has taught us that teams using the doubling sequence are more likely to lose their relative sizing way and start translating directly back into actual days or hours.
Capacity increases as teams learn - as your team's delivery skills and product understanding grow, your relative size throughput should increase compared to six or 12 months ago. That's team performance progress. The key is to consistently use your anchor items for all your relative t-shirt sizing guesses. The goal is consistency with the anchors you base your relative sizing on.
Try It With Your Team
At your next backlog refinement, try sizing a handful of items using t-shirts.
Pick something that feels like a Medium item, make it your sizing anchor, then compare the rest of the backlog to it. Don't overthink it, just go with your gut and see where people agree or disagree.
If it's useful, translate those t-shirts into Fibonacci numbers and start tracking how many points your team delivers each sprint. Make sizing a regular part of your backlog refinement, not a one-off exercise. The more you practice, the more reliable your forecasts will become.
Our RAFT Series
✦ Relative Sizing is one of our CoLab RAFTs - Rapid Agile Forecasting & Tracking techniques. Practical tools we use every day in our coaching and training to help teams make work visible and performance-focused.
Version 2.1, last updated 15 December 2025